IES reports illustrate how lighting from a lamp can be evenly distributed in a room. This information is invaluable for manufacturers, offering a realistic and logical view of lighting in a space.
Basically, artists employ the data from IES reports to refine image junctions and refraction, striving for realism. Yet, extracting precise data from the file can be challenging, mainly through trial and error.
To learn more, dive straight to the section below–

How Can I Access an IES Report on My PC?
Are you having trouble opening an IES report? The issue might be the software you’re using. For instance, Microsoft Word isn’t designed to handle IES reports. Opening them in Word can lead to significant formatting issues.
To open these reports, consider using Microsoft Notepad or Microsoft WordPad. There are also other specialized applications available for the same. If you have Notepad and WordPad, right-click on the file, choose ‘Open with,’ and select your desired application.
Delving into Light Distribution Fundamentals
When designing, introducing Lux data into the software is essential. Adjustments might be needed to ensure the project runs smoothly. Proper light simulation can lead to cost savings, improved efficiency, and more.
The light distribution process relies on lux data, also called the luminous intensity distribution curve. Beyond detailing delicate source traits, it outlines the spatial pattern of fair distribution. In essence, it reveals how soft disperse in various spatial directions.
How Can You Obtain Light Distribution Information?
To measure light distribution from sources, professionals use goniophotometers. When testing with this equipment, the goniophotometer stays stationary while the luminaire rotates vertically (γ axis) and horizontally (C plane axis). This rotation helps determine the spatial intensity of light distribution.
Light distribution is usually depicted in two primary formats: polar and rectangular. Examining the lamp’s capabilities and rotation angle can categorize it into three photometric test methods: Type A, B, and C.
Type A tests are commonly used for signals or car lights. Conversely, Type B and C tests suit floodlights and interior lamps.
Interpreting the IES Report
Grasping the nuances of an IES report isn’t an endeavor suited for everyone. A significant technical aptitude is required to comprehend the information contained within fully.
However, for clarity and simplicity, we’ve outlined the critical sections of an IES report below:
What Does an IES Report Include?
Part 1: Product Information
As defined by IESNA: LM-63-2002, the testing methodologies involving a goniophotometer were refined in 2002. Assessing equipment models using Keyword 1~ n lists utilizing a goniophotometer is recommended.
Upon Testing, various details, such as the make and model of the lamp, its voltage, and current specifications, can be discerned.
Part 2: Test Information
The figures listed after “TILT=NONE” detail a variety of light-related specifications, including the count of light sources, measurement of horizontal angles, light intensity multiplication factors, light luminous flux values, dimensions of light-emitting surfaces, measurement specifics of vertical angles, types of soft distribution curves, and types of measurement units.
Part 3: Test Data
Angles are typically measured vertically, starting from 0.0, whereas the complementary angle is measured horizontally. However, assessing each data point to understand light intensity patterns is essential.
Example: When examining a range of vertical 0-180 degrees, a 10 degree increment is employed for Testing. In contrast, for a horizontal span of 0-360 degrees, intervals are set at every 90 degrees. If X represents the light intensity evaluated at each point, the resultant readings during the breaks will be 0.0, 10.0, 20.0, 30.0, and so on.
Understanding the Luminous Intensity Distribution Report
Upon unraveling the IES details, it’s crucial to familiarize oneself with the subsequent phase, which delves into the Luminous Intensity Distribution (LID) report.
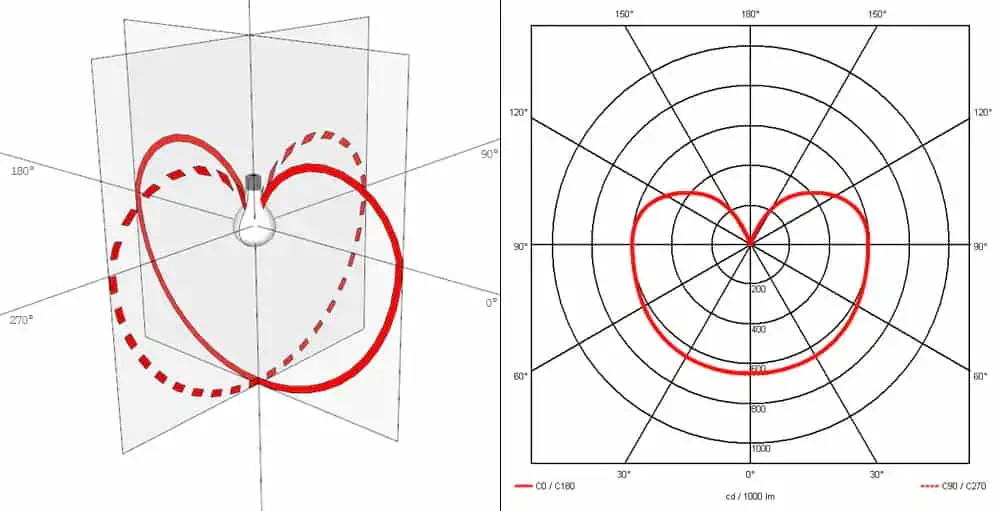
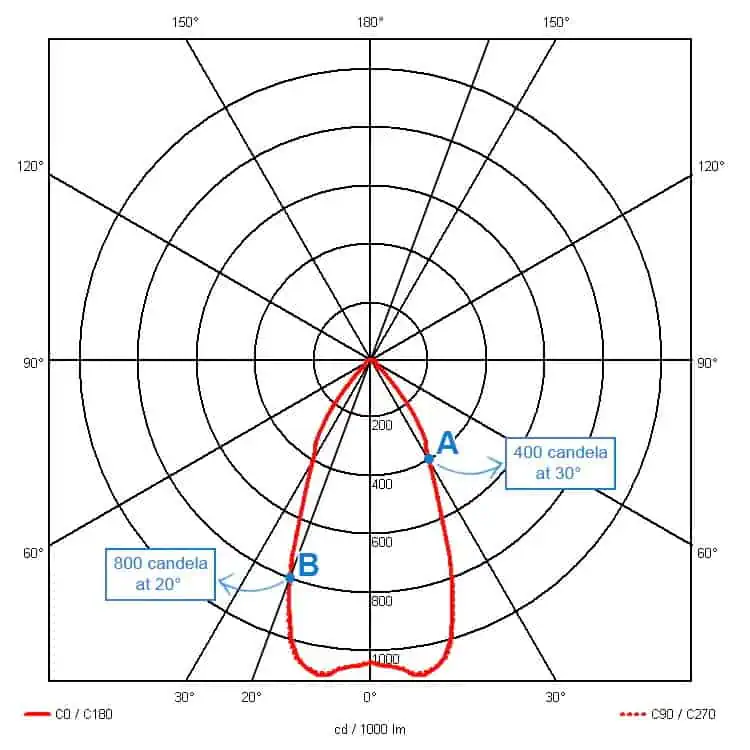
Luminous Intensity Distribution Chart
This chart provides insight into pivotal points concerning light intensity. It underscores how three-dimensional fair distribution can be represented within two-dimensional polar coordinates. Furthermore, the center of the light source can be utilized as the opposite starting point. Four distinct vertical angles aid in measuring luminosity and accentuate the highest intensity value on each curve.
Light Distribution Graph
This graph is a visual representation of light dispersion from any given source. Both three-dimensional and two-dimensional perspectives are integral to understanding this graph.
While initially, the light distribution graph might appear complex, once you grasp the foundational terms, its comprehension becomes seamless.
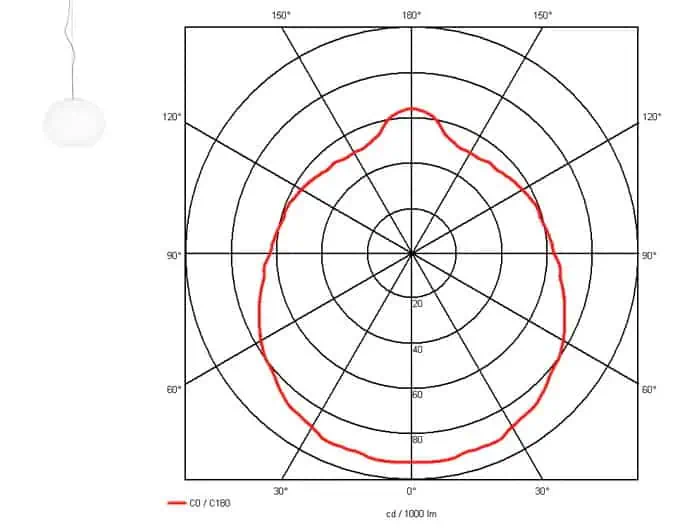
Symmetrical Light Distribution
In a symmetric light distribution, light spreads uniformly in all directions. Yet, the brightness varies from different perspectives. We can illustrate these scattered rays using solid and dotted lines. The solid line represents the front view, while the dotted line shows the side view.
While the basic structure of both light types remains the same, they function differently based on whether they’re viewed from the front or side. Furthermore, these lines often intersect since the light is spread out uniformly.
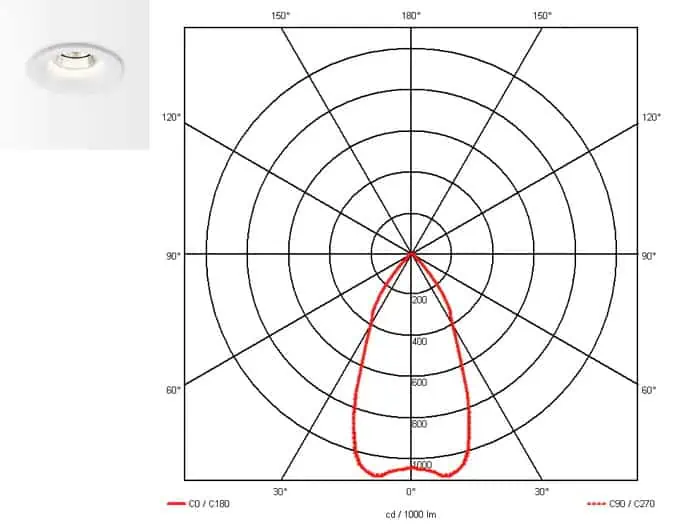
Asymmetrical Light Distribution
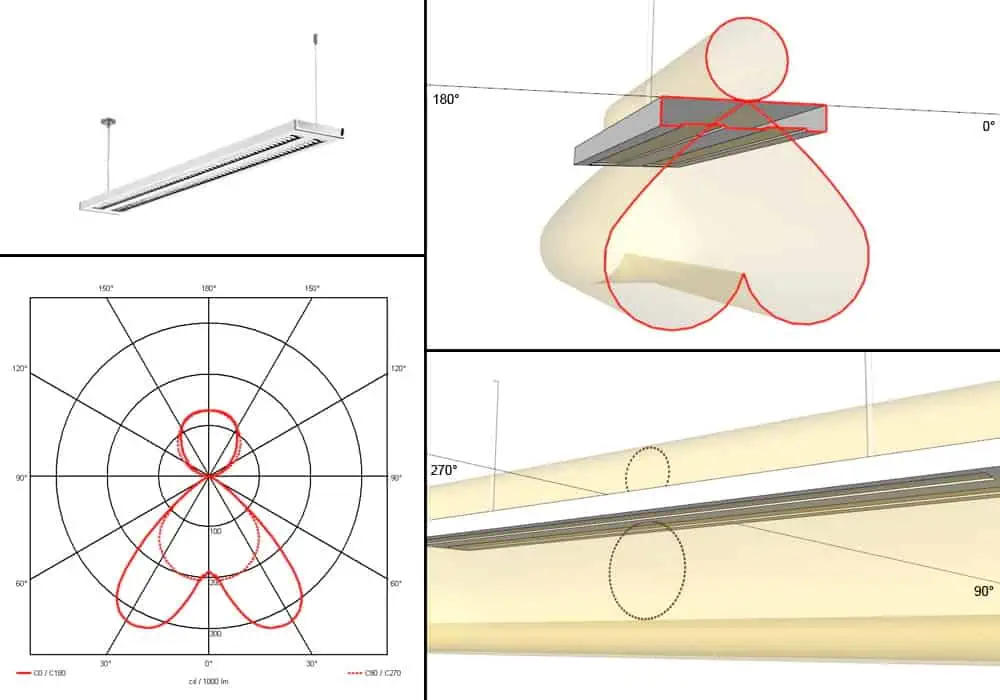
When light from a specific source is channeled sideways or predominantly in one direction, it’s referred to as asymmetric light distribution. Examining the luminaire will give the impression that you face it on a 0-180° axis.
A closer look at the luminaire reveals a spherical plane from the beams above and two spherical planes from those below. This suggests that a singular spherical beam has been divided into two. These eleven distinct distributions are related to the built-in reflector obstructing the central light.
Examples to Explore
- DeltaLight Reo: This design is characterized by overlapping two distinct curves when observed from the front and side. Yet, the light beams remain focused and don’t scatter erratically.
- Flos Glo-Ball: Its unique spherical shape illuminates upwards and downwards. It features two curves intersecting at a specific point, resulting in symmetrical light dispersion.
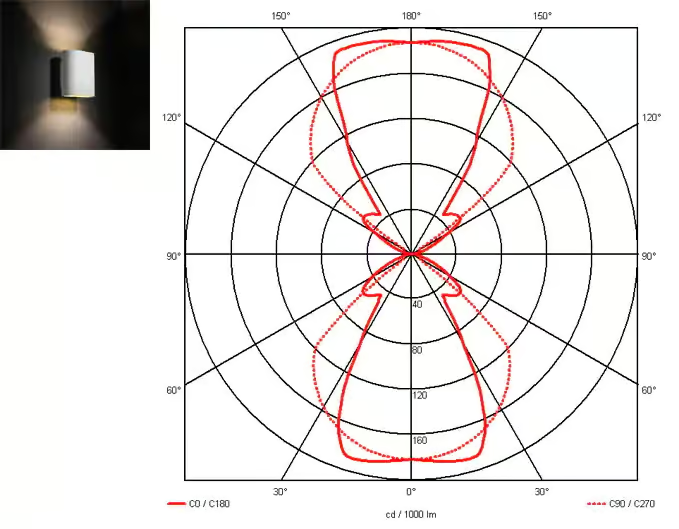
- Modular Lighting Duell: At a direct glance, this light casts both an upward and downward beam. This light reflection can be visualized as a solid red line, especially from a side perspective, which details its delicate distribution pattern. Notably, the similar structure of the top and bottom curves makes it easy to identify.
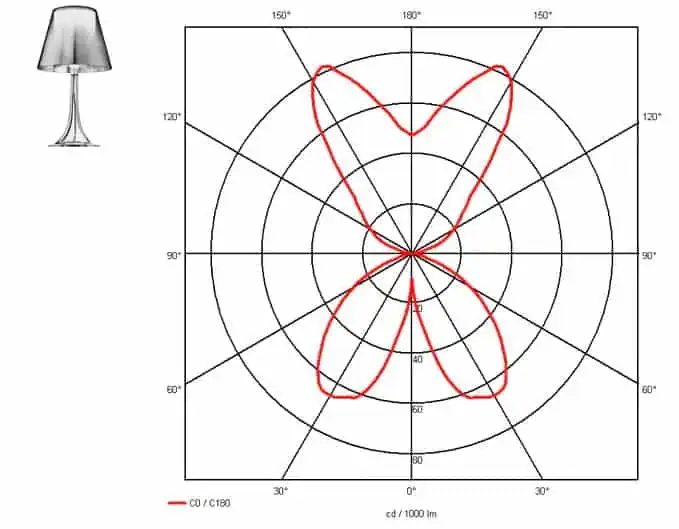
- Flos Miss K: Recognizable as a table lamp, the Flos Miss K has a consistent light distribution. Its curves intersect, with light beams diverging in two directions—upward and downward. The downward light has a distinct division, as the source doesn’t emit light directly below.
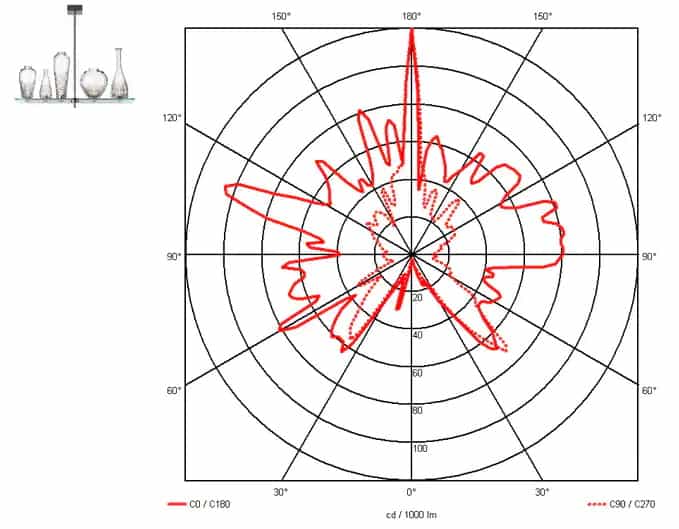
- Flos Cicatrices de luxe: The light beams passing through the glass vases of this design are distinct. This uniqueness is attributed to the star-like shape observed in the light distribution curve.
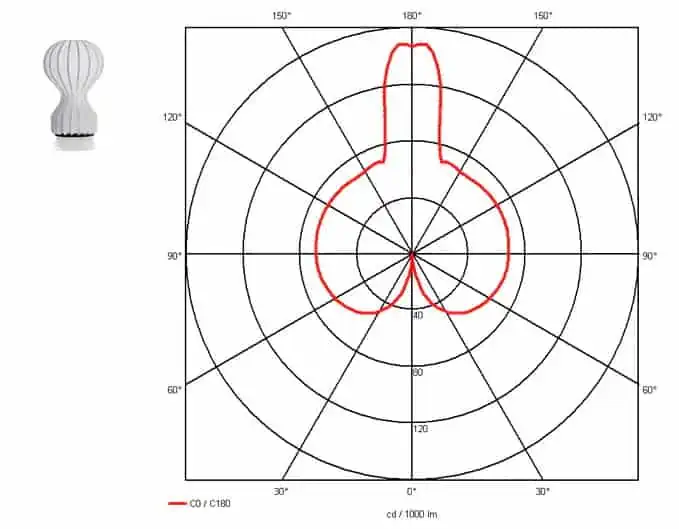
- Flos Gatto: This table lamp design, Flos Gatto, presents a symmetrical light distribution where two curves intersect. The light beams diverge in two directions, both upwards and downwards.
Unified Glare Rating (UGR) Table
The UGR table provides UGR values derived using specialized software. These values are determined based on room dimensions, light dispersion from the source, radiance factors, and reactivity. The table will feature alphabets denoting specific attributes:
- H: Distance from the human eye’s horizontal line to the lamp’s installation line.
- X: Room width.
- Y: Room length.
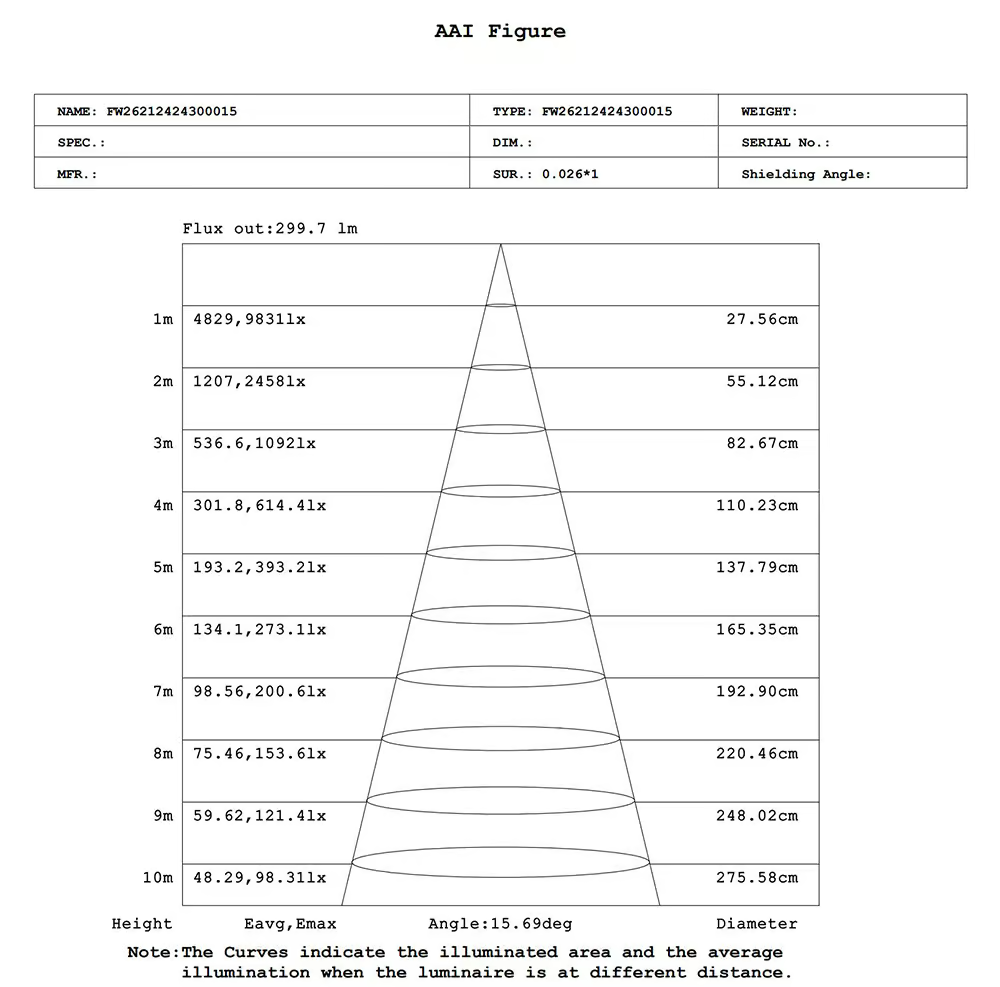
Effective Average Illuminance Diagram
This diagram simplifies understanding of the IES report, illustrating the lamp’s height and light-emitting angle. From it, one can determine:
- Height (1m~10m on the left): Distance from the observation to the light-emitting surface.
- Diameter (on the right): Spot diameter on the observation surface.
- Eavg, Emax: Average and maximum central illuminance on the observation surface.
- Angle: Beam angle size in degrees (°).
Luminaire Photometric Test Report
Before purchasing light-emitting sources, it’s essential to gauge their quality and light distribution. This report offers insight into these aspects. Photometric Testing delivers a detailed laboratory evaluation of light’s quantity, color, distribution, and quality from various sources like LEDs and lamps.
Zonal Flux Diagram
Mainly utilized by manufacturers, the zonal flux diagram evaluates the overall shifts and transition areas. It comprises a two-angle coordinate system: vertical and azimuth angles being pivotal.
Luminance Limitation Curves
These curves represent different classes of light sources. While they highlight specific features over mere specifications, Class A outlines general aspects of individual needs. The curves’ positioning during emission signifies the source’s range and depth.
CU and Luminaire Budgetary Estimate Diagram
The coefficient of utilization (CU) gauges a luminaire’s efficiency in transferring luminous energy to an operating plane. Represented as a luminosity ratio in a given area from a specific light source, CU is vital for designing energy-efficient Controlled Environment Agriculture (CEA) facilities.
WEC and CCEC Tables
Used in indoor lighting design, these tables (short for Wall Existence Coefficients and Ceiling Cavity Existence Coefficients) help ascertain the light quantity emitted within a room and the reflection from walls, ceiling, and floor.
Utilization Factors Table
The utilization factor is the lumens ratio received on a working plane versus those emitted by the light source. Denoted as UF = Lumens on Working Plane / Lumens from luminaires, this table highlights various utilization factors for comparison.
Isocandela Diagram
This is an alternate depiction of luminous flux distribution, aiding in identifying source intensity. Presented as Isocandela curves on an exterior, its values are in candelas per square meter (cd/m2).
AAI Figure
The AAI figure illustrates the illuminated area against average illumination. This contrast is evident when luminaires are positioned at different heights. The Beam Angle is relative to a specified angle/area, revealing the unrepresented extended flux in the data.
Isolux Diagram
Often referred to as is foot-candle, the Isolux diagram visualizes various illuminance values. It can be used to showcase the distribution characteristics of a luminaire and helps in determining appropriate lighting levels.
LED Avg. L Report
The “L” in LED avg. L report denotes the lumen percentage about its initials. The report sheds light on the operational duration of a light source and determines if the light source aligns with the average luminous efficacy.
Planar Illuminance Curve
For optical microscopy, the illumination system is paramount. It facilitates the transmission of light through translucent objects, allowing clear visibility. The planar illuminance curve depicts how this light is manipulated and caters to viewer demands during microscopic observation.
Luminous Distribution Intensity Data
This data visualizes the path of luminous intensity along the luminaire. If the luminaire disperses, the luminous flux travels freely in all directions. Graphically, this distribution can be represented by the curves formed by the luminaire intensity.
Usage of IES Report
IES reports visually confirm that a lamp’s lighting is uniformly distributed within a room. Professionals utilize these report images to optimize light distribution. While a trial and error method might be used, it’s not always efficient. Using Python, one can parse IES report data seamlessly, removing redundancies and preserving only vital, error-free data. This data then facilitates enhanced simulations in programs like Blender, considering specifications such as light hanging distances.
Before finalizing, it’s crucial to preview setups—like gauging the range of light brightness and adjusting light intensity.
IES Vs. LDT
- LDT format highlights specifications like correlated color temperature (CCT) and the color rendering index (CRI), whereas IES doesn’t provide such details.
- LDT primarily focuses on details about the light source, like its configuration and luminous intensity. On the other hand, IES files detail the light distribution within a room.
Manufacturers and 3D artists leverage these files to refine lighting designs and render them with realism.
Opening IES Files on a Computer
While Microsoft Notepad and WordPad are standard tools for viewing IES reports, other compatible software includes:
- Photometrics Pros
- Photometric Toolbox
- Autodesk’s Architecture
- Revit software
- Render Zone
- Visual lighting software
- Photopia
- DIALux
There’s also an interest in free software options, such as:
- IES Viewer
- LITESTAR 4D Open
- Visual Photometric Tool
However, caution should be taken. Some applications might disrupt the file’s formatting or its schematic representation.
Transforming an IES File
Transforming an file IES is straightforward. Just ensure you have a EULUMDAT file (.LDT) on hand. There’s an online converter available on the app spot’s website, free of charge, which supports both IES to LDT and LDT to IES conversions.
In addition, Eulumdat Tools offers similar services. Another option is PhotoView, which may entail additional fees during the conversion process.
For those using the DIALux program, it’s simple to access the Unified Luminaire Data files directly. Moreover, this application makes converting IES files into ULD files a breeze.
Alternative Solutions for IES File Access
You might need alternative methods if the applications above or the software don’t work for your IES files. Consider using Install Shield or ISE Design Suite for IES files containing Xilinx ISE Project or Install Shield Express Project data.
However, if you’re encountering issues with EIP files, it’s worth noting that they might be images developed by Capture One.
Final Thoughts
This article has shed light on critical insights related to IED reports. It aims to provide clarity about IES reports and address potential concerns.
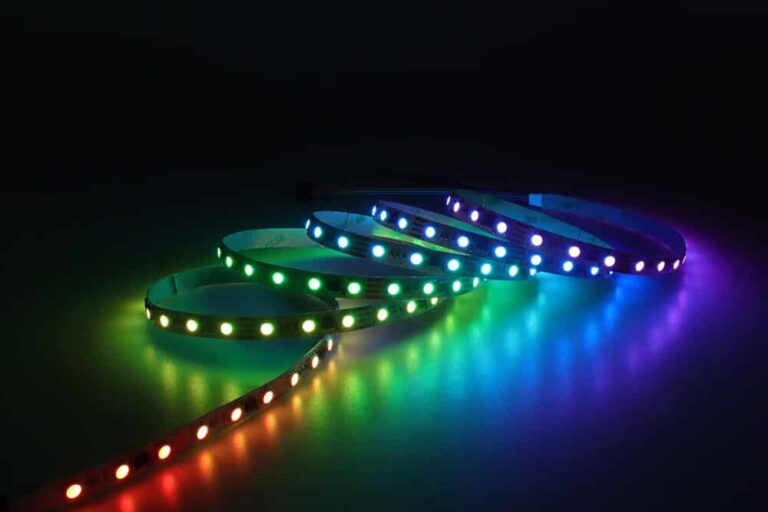
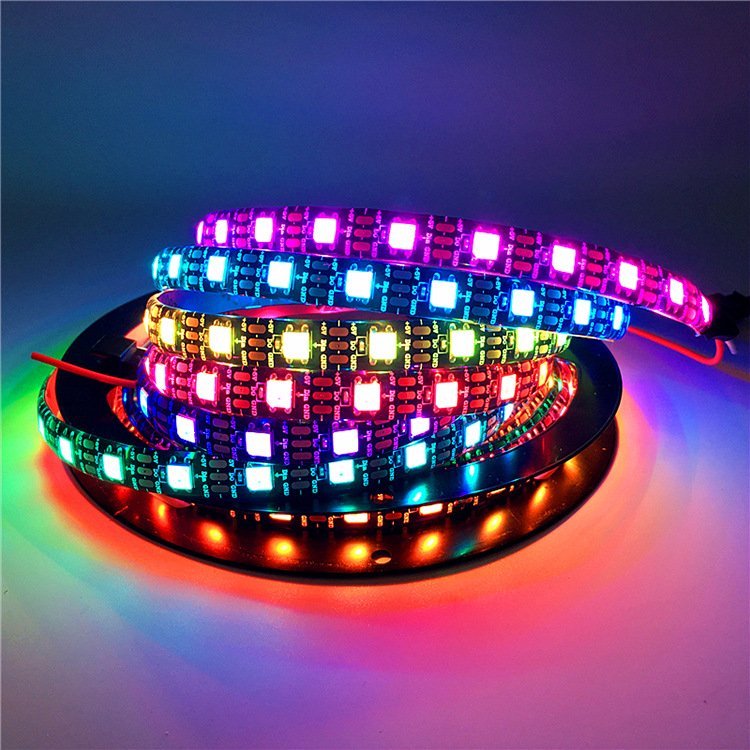
However, Mylikeled delivers top-notch LED strips and LED neon flex products. Every product undergoes rigorous Testing in our advanced labs to guarantee superior quality. Furthermore, we provide tailored solutions for our LED strips and neon flex.
FAQs
What is the connection between IES files and lighting?
IES means measure the brightness, direction, and spread of light from a fixture. Lighting manufacturers use these files to show how a light source will perform in real-life settings. With IES files, designers and engineers can accurately visualize and plan lighting layouts.
Yes, you can edit IES files using software like PhotoView or Eulumdat Tools. Some of these tools are free and allow you to convert or modify the file to match your lighting design needs.
Can SolidWorks open IES files?
Yes, SolidWorks Visualize can open and use IES files. These files show how a light source emits light, helping you simulate and visualize realistic lighting patterns in your 3D models.
What are IES test reports used for?
IES test reports provide detailed information about a light fixture’s performance, such as brightness, beam angle, and energy efficiency. These reports help engineers, designers, and customers choose the right lighting product.
IES test reports are usually created by lighting manufacturers or certified testing labs. They follow specific industry standards to ensure accurate and reliable results.

Hi, I’m Xylia Xiong, a sales professional with 14 years of experience in the LED strip light industry. I specialize in providing tailored solutions, leveraging my expertise in LED products and the latest industry trends. Known for effective communication and problem-solving, I’m dedicated to helping lighting manufacturers, importers, and distributors achieve their goals.
Let’s work together to create customized solutions that exceed expectations.